Mauritius Real Estate Market 2026 Intelligent Investment
Market Overview

Greater Port Louis remains Mauritius’s primary decision-making centre and the island’s core international services hub, supported by resilient financial and professional services activity as well as sustained tourism-linked demand.
As the country’s administrative capital and principal port gateway, the city concentrates government institutions, banking, and trade-oriented occupiers, reinforcing its central role within the national economy.
Macroeconomic conditions remain supportive for real estate investment. Monetary policy has stabilised, with the policy rate held at 4.50% as of February 2026, while inflation is expected to remain within the central bank’s target range. This environment provides a relatively predictable foundation for property underwriting, anchored by a “stable rates / stable inflation” base scenario.
The office market exhibits a clear structural bifurcation. Institutional-grade Grade A space remains comparatively tight, whereas older B-grade buildings continue to experience higher vacancy and increasing competitive pressure from newer developments. This dynamic is particularly evident as occupiers gradually decentralise from the traditional CBD towards modern business districts serving the wider commuter belt.
Industrial and logistics demand is increasingly aligned with Freeport activity and regional distribution networks, with the Jin Fei–Riche Terre corridor emerging as a key logistics cluster. While prime logistics facilities are marketed with more transparent rental benchmarks, the broader industrial market remains fragmented and transaction-driven.
Retail fundamentals remain relatively resilient within institutional shopping centres, where low EPRA vacancy levels and improving trading densities support performance. Development activity across the sector remains measured, suggesting targeted expansion rather than broad-based oversupply.
Occupier behaviour across the commercial property market reflects a growing flight-to-quality trend, favouring modern, well-specified buildings with strong accessibility and parking provision. Congestion constraints within the traditional CBD are gradually reinforcing this shift toward decentralised commercial nodes.
Prime vacancy levels remain materially healthier than those observed in older stock, although a meaningful Grade A development pipeline is expected to intensify competition for secondary buildings in the medium term. From an investment perspective, capital remains focused on well-let, covenant-backed assets in the office and retail sectors, while pricing evidence within the industrial market remains less transparent outside established logistics parks and Freeport-related estates.
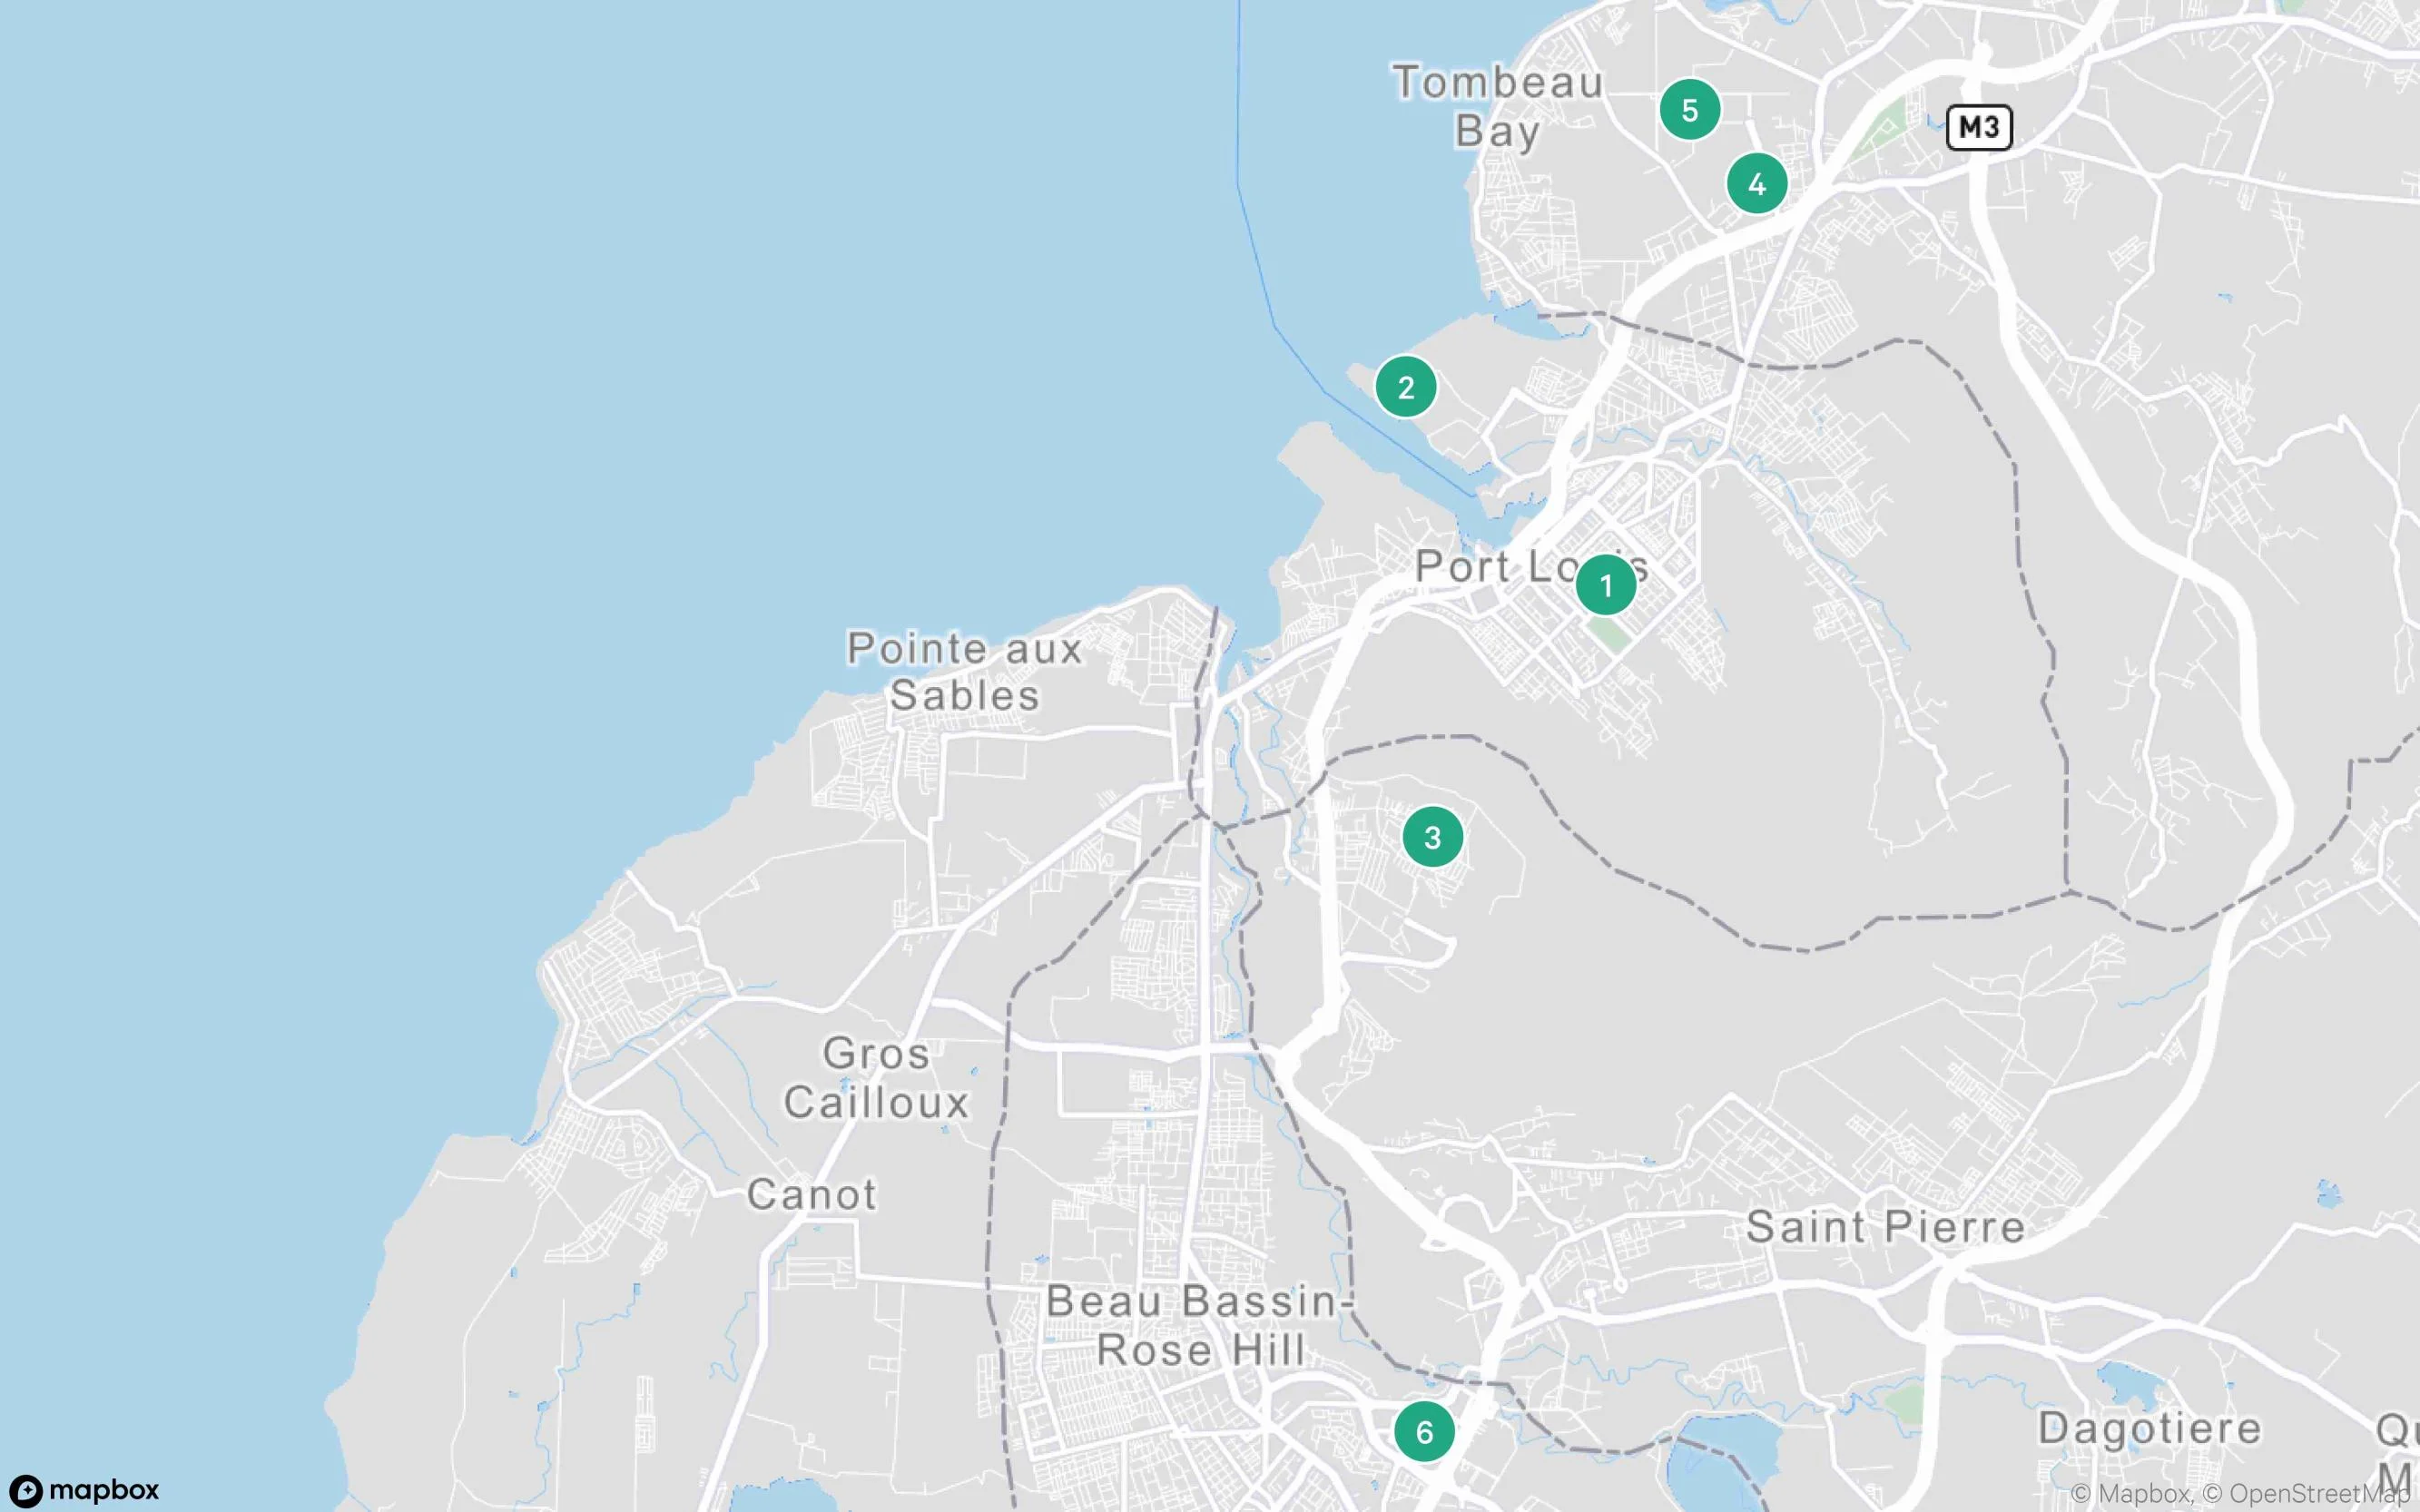
Key Nodes
| # | Key Node | Positioning | Key characteristics |
|---|---|---|---|
| 1 | Port Louis CBD | Financial / administrative core | Government and professional services; constrained parking; mixed-grade office stock; proximity to civic institutions and banks. |
| 2 | Port of Port Louis | Port & trade gateway | Primary maritime interface; logistics adjacencies; Freeport-linked warehousing and distribution ecosystem. |
| 3 | Pailles & Coromandel | Inner logistics / light industrial belt | Warehouse clusters on arterial access; rent levels from transactional listings indicate functional mid-box supply (market remains opaque). |
| 4 | Jin Fei Industrial Zone | Institutional logistics park node | Marketed “industrial & logistics park” product; published rental benchmarks for large-format units; build-to-suit bias. |
| 5 | Riche Terre | Freeport / industrial expansion corridor | Freeport-adjacent industrial area; significant warehousing capacity via specialised operators; connectivity to port and motorway access. |
| 6 | Ebene Cybercity | Prime office district (greater Port Louis) | Largest Grade A concentration outside CBD; development pipeline and occupier migration dynamics shape “greater Port Louis” office market trajectory. |
Market KPI Snapshot
Notes on KPI methodology and transparency
- —Office stock and vacancy are drawn from institutional market commentary (investment-grade segmentation), while Port Louis “total stock” is a proportional estimate using the reported share of national office stock (calculated).
- —Industrial and retail rent benchmarks are drawn from marketed asking rents for institutional product (logistics parks; CBD retail units) and should be treated as achievable only for comparable covenant/fit-out/lease structures.
- —Retail vacancy uses Ascencia’s EPRA vacancy (portfolio proxy for institutional malls), not high-street micro-retail in the CBD.
| Indicator | Office | Industrial | Retail |
|---|---|---|---|
| *Prime Rent | 900 MUR / sqm / month | 250 MUR / sqm / month | 1,000 MUR / sqm / month |
| *Rental Range | 600–900 MUR / sqm / month | 190–260 MUR / sqm / month | 250–1,200 MUR / sqm / month |
| Vacancy Rate (%) | ~7% (prime-grade) | Limited institutional-grade supply / market not consistently tracked | ~1.1% (institutional mall proxy) |
| Prime Yield (%) | ~7.8 | ~10.0 (indicative guidance) | ~7.5 (indicative guidance) |
| Total Stock (sqm) | ~327,000 (Port Louis share of investment-grade stock) | ~550,000 declared Freeport zones (national; incl. port & airport) | >350,000 mall GLA (national) |
| Pipeline Supply (sqm) | ~140,000 (Grade A pipeline; national, near-term) | Build-to-suit pipeline; limited public quantification | ~31,000 (Mall de Flacq 25,000 + Bel Air 6,000) |
*Typically excluding VAT and service charge unless stated
Typical Market Practice
Lease Structure
| Item | Office | Retail | Industrial |
|---|---|---|---|
| Typical lease term | 3–5 years (Grade A); shorter for secondary stock (market practice). | Typically ~5 years in institutional malls (renewal evidence). | 3–5 years common; longer possible for build-to-suit (market practice). |
| Renewal options | Negotiated options; typically 1x term extensions (market practice). | Multi-year renewals common in mall portfolios. | Negotiated options; often linked to capex recovery (market practice). |
| Expansion options | Right of first offer / adjacent space where available (building dependent). | Limited; expansion largely constrained by mall planning and tenant mix strategy. | Yard space / additional bays possible in logistics parks (site dependent). |
| Subletting | Commonly allowed with landlord consent (covenant dependent). | Usually restricted or subject to strict landlord and merchandising consent. | Generally allowed with consent; hazardous/regulated uses tightly controlled. |
Rental Structure
| Item | Office | Retail | Industrial |
|---|---|---|---|
| Quoted basis | MUR/sqm/month; net rent typically excludes service charge and VAT in marketing. | Base rent often supported by performance metrics (rent-to-turnover tracked at portfolio level). | MUR/sqm/month; logistics park quotes commonly “from” rates (unit/scale dependent). |
| Escalation | Often fixed annual uplift; evidence of 2% p.a. on a prime HQ lease (example). | Standard escalation of ~5% referenced in mall renewals. | Typically fixed annual uplift; VAT and service charge may be quoted separately. |
| Payment frequency | Monthly is standard; payable in advance in many institutional leases (market practice). | Monthly; collection rates tracked by institutional owners (portfolio). | Monthly; may include service charge line items (example). |
| Currency | Predominantly MUR for domestic leases; FX indexing is asset/tenant specific (market practice). | Predominantly MUR; turnover-linked dynamics depend on retailer reporting (asset specific). | Predominantly MUR; Freeport-related leases may carry specialised terms (operator specific). |
Financial Obligations
| Item | Office | Retail | Industrial |
|---|---|---|---|
| Security deposit | Commonly 2–3 months’ rent (tenant covenant dependent; market practice). | Commonly 2–3 months’ rent; higher for fit-out risk (market practice). | Often 3+ months on higher-risk uses; guarantees used for larger covenants (market practice). |
| Service charge | Typically payable by tenant (levied separately from quoted rent). | Common in malls; supports common area operations and security. | Common in parks/estates (example of service charge per sqm). |
| Property tax | No broad-based real property tax is commonly cited; local rates/fees may still apply by locality/asset structure. | As left (asset dependent). | Freeport operators have specific regulatory and local rate exemptions under Freeport legislation (context-specific). |
| Utilities | Typically metered to tenant where feasible; back-up power common in Grade A. | Tenant consumption metered; mall utilities and sinking funds may be allocated via service charge (asset specific). | Tenant metered; cold-chain users face higher energy pass-throughs (use specific). |
| Insurance | Building insurance typically landlord; tenant covers contents/public liability (market practice). | Landlord insures centre; tenants often carry public liability and fit-out cover (market practice). | Higher liability emphasis (fire/safety); requirements increase with racking and hazardous classifications (market practice). |
Fit-out and Handover
| Item | Office | Retail | Industrial |
|---|---|---|---|
| Handover condition | Shell & core and fitted options both present in marketed supply. | Typically shell & core with landlord design criteria; fit-out risk managed via approvals (market practice). | Often “as-is” warehouse shell with office pods; specifications vary by park (market practice). |
| Fit-out period | Often negotiated; may be supported by early access where condition allows (market practice). | Typically negotiated; depends on unit size and brand build programme (market practice). | Negotiated; commissioning time required for MHE/racking/cold chain (use specific). |
| Fit-out cost range | Tenant-funded; highly specification-dependent (no consistent public benchmark). | Tenant-funded; materially higher for F&B anchors and experiential concepts (market practice). | Tenant-funded; typically lowest per sqm barring cold storage or automation (market practice). |
| Reinstatement | Reinstatement / “yield-up” commonly required unless otherwise agreed (market practice). | Strict yield-up and facade/signage compliance is typical in institutional centres (market practice). | Reinstatement focuses on racking/slab condition/loading equipment (market practice). |
Transaction Costs
| Item | Office | Retail | Industrial |
|---|---|---|---|
| Brokerage fee | Commonly ~1 month’s rent + VAT, split by agreement (market evidence). | As left. | As left. |
| Legal fees | Parties typically bear own counsel; documentation complexity rises for anchor leases (market practice). | Higher legal input for turnover clauses and fit-out controls (market practice). | Higher legal input for permitted use, H&S and customs/freeport compliance (use specific). |
| Stamp duty | Stamp duty applies on specified documents at registration/transcription; fixed amounts apply by schedule. | As left. | As left. |
| Reservation deposit | Typically not standardised for commercial leasing; security deposit timing is a key negotiation lever (market practice). | As left. | As left. |
Operational Terms
| Item | Office | Retail | Industrial |
|---|---|---|---|
| Parking ratio | CBD is structurally constrained; suburban Grade A typically offers stronger parking provision (market observation). | Customer parking is a core retail driver in destination assets (asset-specific). | Ratios driven by yard depth and truck stacking requirements (site specific). |
| Operating hours | Generally business hours with 24/7 access in modern buildings (building dependent). | Defined mall trading hours; security and access protocols are formalised (asset specific). | Often 24/7 for logistics; controlled gate access (park dependent). |
| Cleaning responsibility | Tenant cleans demise; landlord cleans common areas via service charge (market practice). | Mall common areas via service charge; tenant interiors by tenant (market practice). | Tenant generally responsible; estate management may handle shared yards (park dependent). |
| Building access | Access control is typical in Grade A; resilience features increasingly expected post-2020 (market observation). | Controlled access for after-hours and deliveries (asset specific). | Controlled access for HGV movement and security (park dependent). |
Market Outlook
Overall, the market outlook remains selective, with opportunities concentrated in prime offices, institutional logistics parks, and dominant retail destinations.
Office
Property cycle position: Market Growth Moderating
Prime vacancy is contained relative to secondary stock, but a sizeable Grade A pipeline raises competitive pressure on pricing for older space and increases incentives risk in weaker micro-locations. The investable segment remains covenant-driven, with best liquidity in modern, well-let assets.
Outlook: Hybrid work and “Grade A migration” will continue to favour efficient floorplates and resilient building systems, while older CBD stock competes on price and parking solutions.
Industrial
Property cycle position: Market Growth Accelerating
Institutional logistics product in the Port Louis–Freeport catchment is being marketed with clear rent benchmarks, reflecting strengthening demand for modern warehousing tied to distribution and trade flows. Supply visibility is improving in formal parks, but the broader market remains fragmented, supporting a “quality scarcity” premium.
Outlook: Freeport-led logistics and regional distribution demand should keep prime parks in the Jin Fei / Riche Terre corridor supported, with rental growth concentrated in institutional, well-serviced estates.
Retail
Property cycle position: Market Growth Moderating
Institutional mall portfolios report low vacancy and improving trading densities and footfall, indicating solid underlying demand for dominant destinations. Development activity continues, but is concentrated in specific projects and locations, pointing to selective rather than broad-based expansion.
Outlook: Institutional malls show resilient occupancy and improving trading metrics, but expansion is selective and concentrated in defined pipeline projects.
Contacts
To find out more about CBRE Excellerate services, contact:
+27 82 465 0023
Hildegardrohr@cbreexcellerate.com
Disclaimer: This report is provided for informational purposes only and is based on data obtained from sources believed to be reliable, including industry databases, tourism authorities and publicly available information. While reasonable care has been taken in preparing this analysis, no representation or warranty is made regarding the accuracy or completeness of the information. The views expressed reflect current market conditions at the time of publication and may change without notice. This document does not constitute investment or professional advice, and readers should conduct their own due diligence before making any decisions based on its contents.
Confidential & Proprietary · © 2026 CBRE, Inc.